

Vehicles 2 Lease · Vehicle leasing
Form conversion from roughly 1% to 4%
~1% → ~4%
Form conversion
Growth · Conversion
By SimonMeasured 4 September 2026
Watching what people actually do on your site and removing whatever stops them getting in touch. Vehicles 2 Lease report form conversion moving from roughly 1% to roughly 4%.
Inside a growth block
from £250 /month
A block of hours spent on whatever moves the business — this, and everything else on the growth list. No percentage of your ad spend.
No minimum term. Move up, move down or stop whenever you see fit.
How the growth blocks workWhat you get
Analytics and event tracking that shows where people drop out
Enquiry and checkout journeys rebuilt with fewer steps and an obvious next action
Page speed and layout stability, because a jumping button loses the click
Copy and layout changes tested where there is traffic to test with, and judged where there is not
Phone, form and chat routes all counted, so the number is the real number
Measured, not claimed
Van leasing is a price-comparison market where every competitor looks identical. We rebuilt the site around qualified enquiries rather than traffic — and the client reports form conversion moving from about 1% to about 4%.
~1% → ~4%
Form conversion
reported by the client
Source: Kris, Director, Vehicles 2 Lease
A site with 1,000 visitors a month and 20 enquiries converts at 2%. There are two ways to reach 40 enquiries, and they are not equally priced.
| Route | What changes | Ongoing cost |
|---|---|---|
| Buy traffic | 1,000 → 2,000 visitors at 2% | Every month, for ever, rising with competition |
| Improve conversion | 1,000 visitors at 2% → 4% | Paid once. Compounds with every future visit. |
The first is a subscription; the second is an asset. It is also why conversion work belongs before an ad budget rather than after it — paid traffic arriving on a page that converts at 1% is an expensive way to demonstrate a problem you could have fixed first.
Almost every business I start with is making decisions on a conversion rate that is wrong, usually in both directions at once.
So the first fortnight is usually spent making the baseline true rather than making it better: every enquiry route tracked as an event, internal traffic excluded, and a cookieless page-view count kept alongside the consented one as an honest denominator. It is unglamorous, and it is the only way the second month means anything.
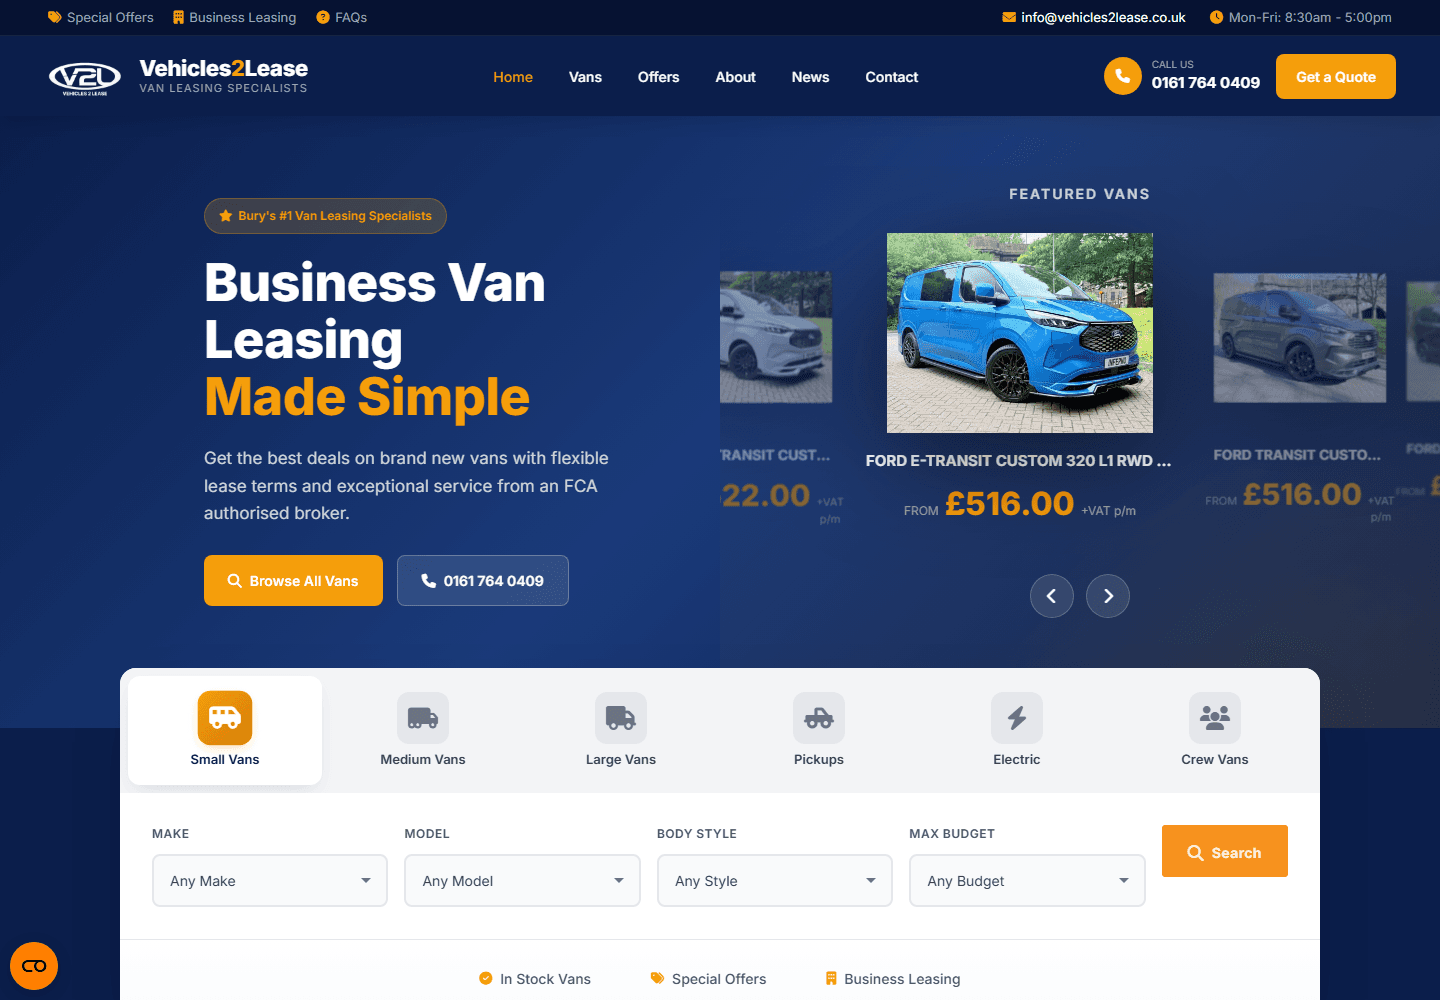
Vehicles 2 Lease is an FCA-authorised vehicle leasing broker in Bury. The listings were restructured around a clear pricing hierarchy, the enquiry journey was rebuilt with fewer fields and an obvious next step, and the phone number was kept in reach throughout. The build is fast: 0.19 seconds to first byte, 0.89 seconds to first contentful paint, zero layout shift, measured on the live site.
The client reports form conversion moving from roughly 1% to roughly 4%.
Locally
Conversion work is the least location-dependent thing on this list, but there is one Greater Manchester pattern worth naming: trades and service businesses here take a very high proportion of their enquiries by phone, and almost none of them are counting it.
That single omission distorts everything downstream. The site looks like it converts at 1% when it converts at 4%, the ad account optimises toward the minority of customers who fill in forms, and every decision made on those numbers is made against a business that does not exist. Fixing it is a few lines of tracking, and it is usually the first thing I do.
The second local pattern is the kerbside one. A paving quote, a plumber, an installer — the page is opened on a phone, outdoors, on a poor signal, by somebody who will give it a few seconds. That is why the speed and layout-stability figures in the case studies are conversion numbers as much as engineering ones.
Written by Simon, who does the work.
Also inside the growth block
All of these sit under the growth block, where the pricing and the process are the same whichever you pick.
Technical, local and content SEO with the results measured in Search Console rather than a slide deck. Beds.ie went from 672 to 7,781 organic clicks a month in five months.
Catalogue structure, product data and shopping feeds — the three things that decide whether a large store is visible. Beds.ie went from 672 to 7,781 organic clicks a month in five months, with 94.5% of a 17,233-item feed approved.
The map pack sits above every other result on a local search, and getting into it is mostly not a website job. This is the work that decides it.
Crawlability, structure, index coverage, speed and structured data — the half of SEO that is engineering, and the half where the largest untouched gains usually are.
People increasingly ask ChatGPT, Google AI Overviews and Perplexity instead of scrolling results. AI optimisation is the work of making your business the answer those systems give — and of being honest about which parts of it can be measured.
Search and Shopping campaigns managed inside your growth block — not for a percentage of your spend. Agencies commonly take 10–20% of what you spend to manage it, and up to 40% on small accounts; the hours cost the same whatever your budget.
Facebook and Instagram campaigns — creative, audiences, tracking and reporting — managed inside your growth block, with artwork done in-house rather than billed separately.
Planned, designed and posted for you — as part of the growth block, so it serves the same goals as the website and the ads instead of running as a separate hobby.
GA4, Search Console, Google Ads and Meta conversions set up properly and reconciled, so every other decision is made on real numbers.
Paid search, Shopping and paid social managed inside a growth block. The fee does not move when your budget does, which is the whole point.
A list of what is wrong, in the order it is worth fixing, with the reason each one matters. Not a 90-page PDF from a tool with the logo changed.
The only audience you actually own. Everything else is rented from a platform that can change the rules on a Tuesday.
Pages written to answer a question somebody is actually asking, in a volume the business can sustain. Not a blog nobody reads, published fortnightly forever.
A genuine performance channel for some products and an expensive way to make content for most. Which one you are depends on the product, not the budget.
The most precise B2B targeting available anywhere, at the highest cost per click of any mainstream platform. Both halves of that sentence matter.
Straight answers
Enquiries divided by visitors, counted properly: form fills, phone taps and chats all tracked as events, internal traffic excluded, and a cookieless page-view count as the denominator. The first job is usually fixing the tracking so the baseline is true.
It is usually the cheapest growth available. Doubling conversion doubles enquiries without buying a single extra visitor. What a small site cannot support is a formal testing programme — below about 10,000 visitors a month you make evidence-led changes and measure direction.
For a service business with a form as the main enquiry route, somewhere between 1% and 5% is typical. Published industry benchmarks are unreliable because they aggregate incompatible definitions; your own previous month, measured the same way, is the only comparison worth acting on.
The changes ship in days; the measurement takes a month or two, because you need enough traffic for the comparison to mean anything. If the tracking has to be rebuilt first, the honest baseline is a fortnight away before any improvement starts.
Only at real volume. Session recordings, the enquiry data you already have, and five conversations with recent customers will tell you more, faster and for nothing.
Send me the site and what you are trying to achieve this year. I will tell you honestly which block makes sense and what the first month would go on.